The short story is this one — after 10 years of manually selecting and aggregating the best geospatial news to share with the community, Slashgeo has ended its journey and will now cease publication.
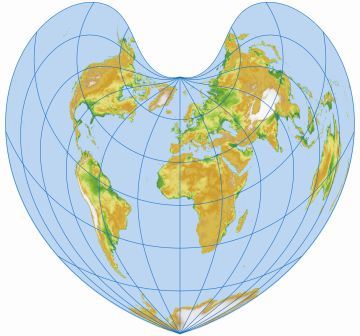
The longer story involves abusing the Bonne projection, being mesmerized by our magnificent planet seen through the eyes of satellites and drones, finding my way within the avalanche of crowdsourced and open geodata, feeling like floating and flying around the globe into new dimensions thanks to virtual globes and augmented reality. The future promises to be full of wonderful surprises for the geospatial professionals!
No, my love for geospatial has not waned and my day job still has ‘geospatial’ in its title. But I find myself in a professional position where I don’t want to the spend the time to ‘fix’ Slashgeo to make it what I’d like it to be and where finding the time to aggregate geonews has become more labor than fun. When I launched Slashgeo in, I envisioned it as a tool for the geospatial community by the geospatial community. While a handful of Slashgeo editors contributed to the project over the past 10 years, and I have to sincerely thank them for their contributions, Slashgeo never became self-sustaining.
Stats don’t really matter at this point right? Slashgeo nonetheless published several thousands geospatial news, in the adventure our newsletter reached thousands of subscribers and website analytics informed me that the geonews we shared with the community was reaching over 10,000 geospatial professionals. Not a bad achievement! We also received tens of donations over the past 10 years, this really made a difference and encouraged me to go on.
Now what? I don’t want to leave you, our dear users, in the dark. Since I’ll most probably continue reading geospatial news anyway, my plan is to share the ones I find worthy via the Slashgeo Twitter account. To be honest, I don’t like Twitter, I hate its low signal/noise ratio — Slashgeo was there exactly to provide a high signal/noise ratio to geogeeks — but that’s the best compromise I found so far. Of course, you can read other geospatial news sources, the ones I recommend are Planet OSGeo since geospatial open source is part of our future - even if you get a strange mix of entries from that source, the Google LatLong blog since whatever they do, with the ubiquity of Android, Google Maps and impacts of their geo-projects, they can’t be ignored, I also invite you to read the Mapbox blog because it’s a company I admire for their contributions to geospatial in general and to open source and OpenStreetMap in specific — they lead plenty of great projects, including turf.js, and finally, if you’re looking for a generic geospatial news website, I consider GeoAwesomeness the best one around at the moment, actually much better than Slashgeo lately!
I am a man of passion. And I have many of them. Aside from my family and kids, I’m also devoting more and more time to music. My first CD was released before Slashgeo came to life, my second one, named ‘Unanimoog, escape inside the music’, was released on the last day. I warn you right away, it’s not music you would hear on the radio (yet?) and you may not like that kind of synthetic sounds at all. It’s an album 100% made with a single award-winning iPad app, Animoog, no loops, no sequencer, no effects, no hardware involved other than the iPad. If you’re into music, you know that Moog has a cult status. I’ve been lucky and my album made the front page of Moog Music’s website and has been acclaimed by many, including in this Create Digital Music article. Here’s the first of the amateur and homemade videos I recorded live with the default iTunes visualizer (undocumented iTunes visualizer keyboard shortcuts described here). Because the presets I leverage feature omnipresent ping pong stereo panning, you need headphones to enjoy such music.
Here’s another one of the 47 tracks of the album, named ‘don’t June’. Headphones still required. The whole album, like mostly everything I do, is not only free to download, but also creative-commons licenced.
Thanks for the past 10 years and enjoy life! — Alex / Satri for Slashgeo.