Recent Posts

Slashgeo is a proud media partner of FOSS4G-Asia

We are happy to inform you that Slashgeo will be a proud media partner of the upcoming Free & Open Source Solutions for GIS (FOSS4G) - Asia conference held in Bangkok, Thailand, 2-5 December!


FOSS4G-Asia aims to bring together FOSS4G users and developers worldwide and foster closer interactions with and amongst Asian communities in order to share ideas for improving software and applications. The Bangkok conference will cover all aspects of FOSS4G, Open Data and Open Standards, with a particular focus on exchanging experiences between FOSS4G users and developers and providing first-hand information on FOSS4G for developing national/local spatial data infrastructures in Asian countries. FOSS4G-Asia also commemorates ten years since the FOSS-GRASS User Conference was held at Faculty of Engineering, Chulalongkorn University, Thailand between 12-14 September.

Workshops will also be offer on QGIS, ZOO project, MapMint, InaSafe, pgRouting, OpenStreetMap and OpenLayers 3.

Slashgeo will publish articles during and after the conference on what has been highlighted in presentation, workshop and innovative ideas on the geospatial open source, open data & open standard  front in Asia and elsewhere.

GC2 is improved

Mapcentia has had a busy summer where a lot of new GC2 features have been implemented to meet requests from an increasing number of enterprise users. Below are the most significant:

Sub-users

You can now create sub-users for all your team members working on the same PostGIS database. A sub-user is a user with limited privileges to selected layers, which is managed by the parent-user. A sub-user can be granted one of four privileges to a layer:

None: The layer doesn’t exist for the sub-user.
Only read: The sub-user can see and query the layer.
Read and write: The sub-user can edit the layer.
All: Read, write and change properties like style and alter table structure.

Privileges are also applied to WMS and WFS-T. Sub-users can choose their own HTTP authentication password for the web services.

A sub-user can also be assigned its own schema, where the sub-user can create layers of its own. If a team member needs to manage some data sets, you can create a sub-user and a schema for the member. The member can when grant layer privileges to other sub-users, which makes it very easy to share data across a team.

Track changes

Another novelty is “Track changes” in layers. This feature enables you to keep the history of edits in the layer. It works through the online editor and WFS-T clients like QGIS. This way you don’t lose valuable data and you can track team members edits.

You can read more about Track changes here

New front page and dashboard

We’ve revamped the front page and the dashboard. If you run your own GC2 server it’s now possible to brand with own corporate logos and text.

Cluster map

You can now turn a point dataset into a cluster map in a couple of seconds. Clustering happens server side and works just like any other layer. Clusters can be classified and styled with MapServers advanced styling. The Class Wizard will create a basic cluster map for you.

Online editor improvements

The online editor has gotten some useful improvements. You now set feature filtering before loading, which makes it easier to partially load huge datasets. A new “Quick draw” function will take you directly to the draw tool without loading data. This way you can add new features to a dataset without actual loading data first.

Schema drop/rename

Schemas can now be dropped and renamed. If you rename a schema, keep in mind that the layer ids will change, whereas they comprise both schema and layer name.

Layer move

Layers can now be moved between schemas. As for schema renaming, moving a layer will change the id.

Create query views

You can now through the Database tab create a view over a SELECT query, which gives a name to the query that you can refer to like an ordinary table. The query is run every time the view is referenced in a query. Views are a very powerful tool and now they are easy to create.

Google Add-on

After a long wait, Google has accepted the MapCentia GC2 Add-on for Docs. Now you can insert your maps directly into a Google Doc. Try it

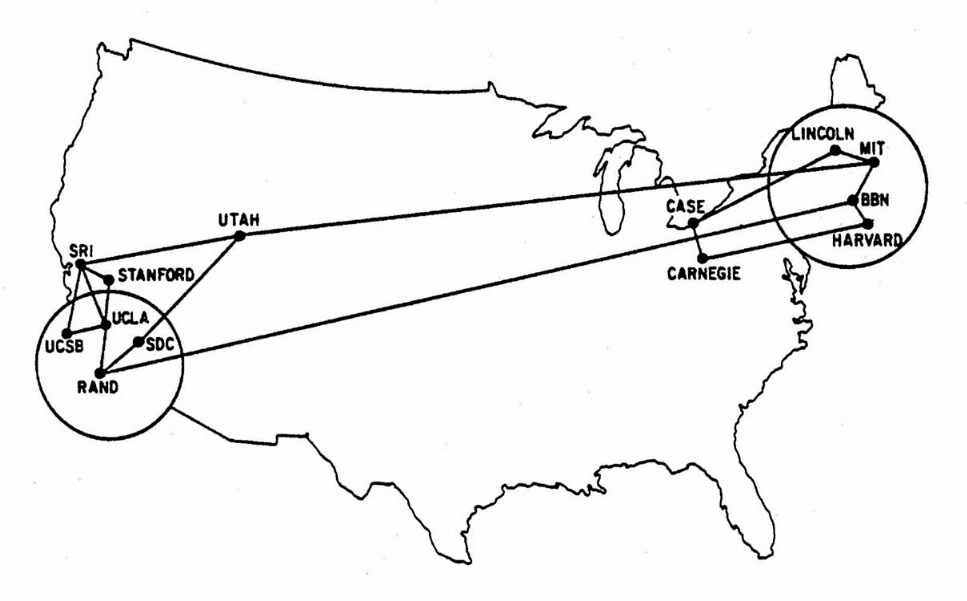
40 Maps that Explain the Internet

Spatially Adjusted pointed me to a collection of maps published last June named 40 maps that explain the Internet. The Internet now being integrated into most of our daily lives, these maps do say a lot about the current state and how we got there.

Their introduction: “The internet increasingly pervades our lives, delivering information to us no matter where we are. It takes a complex system of cables, servers, towers, and other infrastructure, developed over decades, to allow us to stay in touch with our friends and family so effortlessly. Here are 40 maps that will help you better understand the internet — where it came from, how it works, and how it’s used by people around the world.”

But really head to the website to have a quick look at the maps themselves, from the growth of the network, to pornography consumption by U.S. state, to tweets according to the time of day.

map-D: GPU-based Geospatial Database Analysis

The company launched last year but we never mentioned map-D before. map-D claims to offer the fastest database thanks to directly leveraging graphic cards (GPU).

From their website: “Map-D can query, analyze and visualize billions of data points in milliseconds. From gigabyte to terabyte, we marry SQL with the world’s fastest data processing pipeline. Complex machine learning, GIS and 3D animation on live streaming data are all simple with Map-D. […] Map-D is a vertically-integrated end-to-end solution for data querying, visualization and analysis. It uses the immense computational power of next generation-parallel hardware like graphics processing units (GPUs) and Intel Many-Core processors (such as the Phi card) to form the the backbone of a data processing and visualization engine, marryings the data processing and querying features of a traditional RDBMS with advanced analytic and visualization features.”

Anyone wants to provide feedback on map-D or GPU-based geospatial databases?

Batch Geonews: Book of OpenLayers 3, 30m Worldwide DEM, U.N. Guide to GeoStandards, and much more

Here’s the recent geonews in batch mode, covering most of September up to today.

On the open source / open data front:

  • It’s there now, announcing the release of The Book of OpenLayers 3
  • Be ready, within a year we’ll have all SRTM-DEM Level-2 (30m) data for the whole world, NGA Releases Hi-Res Elevation Data
  • Here’s the Heron Mapping Client, a open source web mapping  that works with GeoExt and OpenLayers that we never mentioned before
  • An entry on WebGL and the Babylon.js globe code
  • Good news, Canada’s City of Montreal gave an exception to allow its data to be used for OpenStreetMap [in French]
  • OpenStreetMap shines in less accessible places, OpenStreetMap data in Syria
  • Natural Resources Canada updated its Canada-wide free vector dataset to CanVec+, now with frequent data updates, the most up-to-date data and the best available data resolution
  • In Europe next year, FOSS4G-Europe will be in Como, Italy, July 14-17
  • It may be just a bug fix release, but GDAL/OGR being everywhere, it matters, GDAL/OGR 1.11.1 released
  • Another minor update for a popular software, PostGIS 2.1.4 Released
  • Getting ready for the next release, upcoming to QGIS 2.6 – tons of colour improvements

On the Esri front:

  • More is good, ArcGIS Open Data September release: charts, updated admin, and CSV support
  • Users can now generate contours dynamically with a new raster function
  • The Elevation Analysis Geoprocessing Services are officially released
  • New version, CityEngine .1 released
  • A summary, What’s New in ArcGIS Online (September)
  • An upcoming free webinar, Learn How to Leverage ArcGIS Platform and the Cloud with Your Data

Geospatial stories discussed over Slashdot:

  • AR sand maps, Marines Put Microsoft Kinect To Work For 3D Mapping
  • Getting closer to the holodeck, Microsoft’s “RoomAlive” Transforms Any Room Into a Giant Xbox Game
  • Planned, GM To Introduce Hands-Free Driving In Cadillac Model
  • But, Once Vehicles Are Connected To the Internet of Things, Who Guards Your Privacy?
  • Win-win? Surprising Result of NYC Bike Lanes: Faster Traffic for Cars
  • Wearable drones in development, Nixie Wearable Drone Camera Flies Off Your Wrist
  • Drones in the cold, Drone-Based Businesses: Growing In Canada, Grounded In the US
  • Nothing new there, Drones Reveal Widespread Tax Evasion In Argentina
  • More UAV, FAA Clears Movie and TV Drones For Takeoff
  • And California Governor Vetoes Bill Requiring Warrants For Drone Surveillance
  • Privacy, Treasure Map: NSA, GCHQ Work On Real-Time “Google Earth” Internet Observation
  • Phone tracking, Before Using StingRays, Police Must Sign NDA With FBI
  • Know where to not go, London’s Crime Hot Spots Predicted Using Mobile Phone Data
  • Sad news thanks to remote sensing, Aral Sea Basin Almost Completely Dry
  • They forgot the vikings, Maps Suggest Marco Polo May Have “Discovered” America
  • The brain and location, Nobel Prize For Medicine Awarded For “Brain GPS” Research

In the everything-else category:

  • Why standards matter, a U.N. Guide to the Role of Standards in Geospatial Information Management
  • Harvard says so too, Where Location Analytics Can Save Corporations from Drowning in Big Data
  • Wow, we’ll have such 3D visualizations in a few years, Euclideon Teases Photo Realistic Voxel-Based Game Engine
  • Becoming a spy & DIY, Arduino-Based Vehicle Tracker With GPS+GPRS
  • Planned for next week, a free webinar on Forensic GIS - Investigation, Litigation and Using GIS in the Courtroom
  • HERE’s still here, another free webinar in two weeks, HERE Mobile SDKs for Business: Add location services to native applications
  • MapQuest launched “Commute”: The Simplest App For Information About Your Daily Drive
  • Looking for a list? JavaScript for Geospatial applications: An Overview
  • A generic Wired article on hyperspectral remote sensing, An Algorithm That Decodes The Surface of the Earth
  • On the technical side, how to drastically reduce the size of GeoTIFFs, GeoTIFF tile de-duplication
  • Also from Wired, with a map, How Global Shipping Could Change Our Understanding of Biodiversity
  • Remote sensing, DigitalGlobe introduced the PERSPECTIVES Magazine
  • Beautiful, Exploring Ocean Tectonics from Space
  • For those looking for a change, Boundless still provides a list of jobs, The Spatial IT Job Board
  • Geo for everything, Mapping Your LinkedIn Connections in skycrapers
  • A useful comparison of Google My Maps vs Google Maps, which both were recently updated
  • Indoor mapping, With iPhone 6 and iOS8 Apple starts to be serious about indoor location
  • Monitoring all items in a store, Passive RFID is passé … Not so fast my friend
  • There’s a few MapBox announcements, Introducing the Surface API, the Walking directions API and the Introduction of the Mapbox Studio
  • How the ground moves, First InSAR deformation maps of Sentinel-1A from the recent Napa Valley earthquake

In the maps category:

  • Nice for gifts or other, Fantasy Maps of U.S. Cities
  • Crazy, Great Britain in Minecraft 2.0 by the Ordnance Survey
  • Design matters, map of the Highways of the United States of America by Cameron Booth
  • Birds too have to adapt, New Maps Show Where Birds Will Fly as Earth’s Climate Changes
  • Mapping the underworld, Hidden Archeology of Stonehenge Revealed In New Geophysical Map
  • Interesting maps of geniuses in Europe from 1400 to 1950, The Geography of Genius
  • Maps and infographics are useful to understand the world, Who likes whom in the Middle East? Key players & relationships
  • Politics, Scottish Independence Referendum, Election Maps in QGIS
  • Interesting, a map of The Fragility of the State Fragility Index
  • Interesting from an historical perspective, Uncovering Hidden Text on a 500-Year-Old Map That Guided Columbus
  • Not certain if we already shared that one, FlightRadar24, live air traffic on a map
  • It’s dramatic and efficient map visualizations, Three Ways to Visualize Our Melting Northern Ice Cap